Welcome!
Thank you for visiting our site profiling our work on the developing tooth! This work includes ChIP-seq data we generated for the E13.5 incisor (GSE197645), single cell transcriptomic data from GSE142201 , bulk transcriptomic data from SRP308455, and GWAS data from the GWAS catalog. Detailed scripts for this project can be found at our github page.
This project also included the functional annotation (18 state chromatin segmentation) of all ENCODE mouse ChIP-seq datasets (performed by Alexis Hardy), which are available here.
To further explore our single cell transcriptomics analyses, please check out our Shiny Server! This allows you to explore expression of your favorite genes, scores of our custom modules, gene ontology classifications, cluster makeup percentages, and more.
Please check out our preprint of all analysis on biorxiv.
Integration of Multimodal Data To Prioritize Candidate Dental Disease Genes
By integrating the datasets mentioned above and outlined in detail in the following sections, we generated a prioritized gene list which can be explored in the following dropdown menu.
We validated AGAP1, a high-priority novel candidate gene which had previously been assayed as a loss of function whole-body knockout by the Knockout Mouse Project.
Exploration of Prioritized Dental Disease Genes
Validation of Agap1 as a Novel Dental Disease Gene
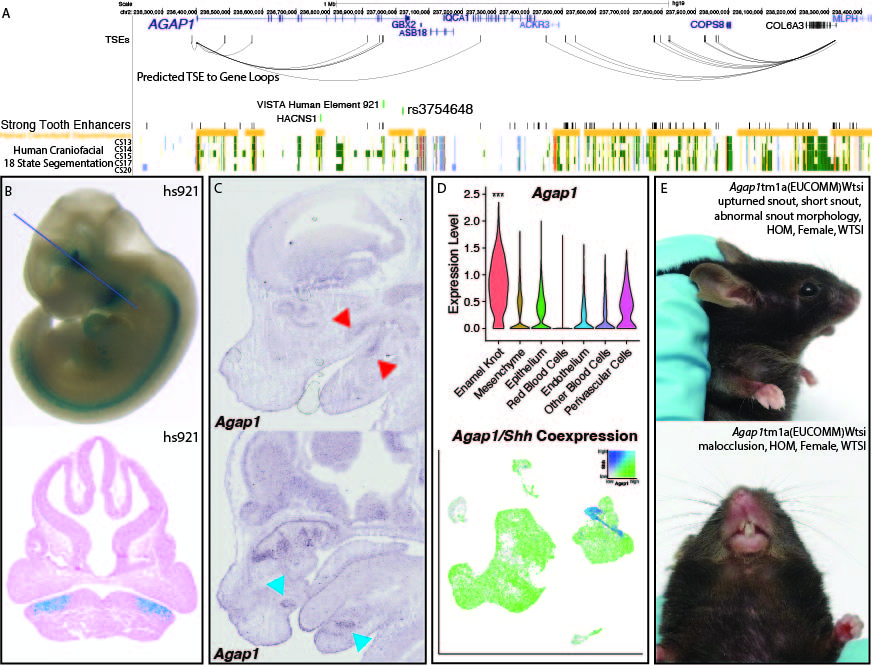
A. Visualization of the hg19 locus surrounding AGAP1. TSEs, strong tooth enhancers, and predicted TSE to gene loops were determined as described (Methods) using mm10 coordinates and lifted to hg19. B. VISTA-validated enhancer hs921 demonstrates activity in the pre-mandibular pharyngeal arches, where it is limited to the approximate pre-dental regions. Images from VISTA [94]. C. Agap1 expression is apparent in both the maxillary and mandibular molars (top, red arrows) and incisors (bottom, pink arrows). in situ hybridization images from GenePaint [74–77]. D. Single cell transcriptomic analysis demonstrated the PEK-specific expression of Agap1 in the E14 mouse molar. p<0.05, Wilcoxon test. E. Agap1 loss of function mutations in mice result in malocclusion and abnormal facial feature phenotypes at 13 weeks postnatal age. Images from KOMP [115].
Conserved Craniofacial Enhancers Contribute to Dental Development and Disease Risk
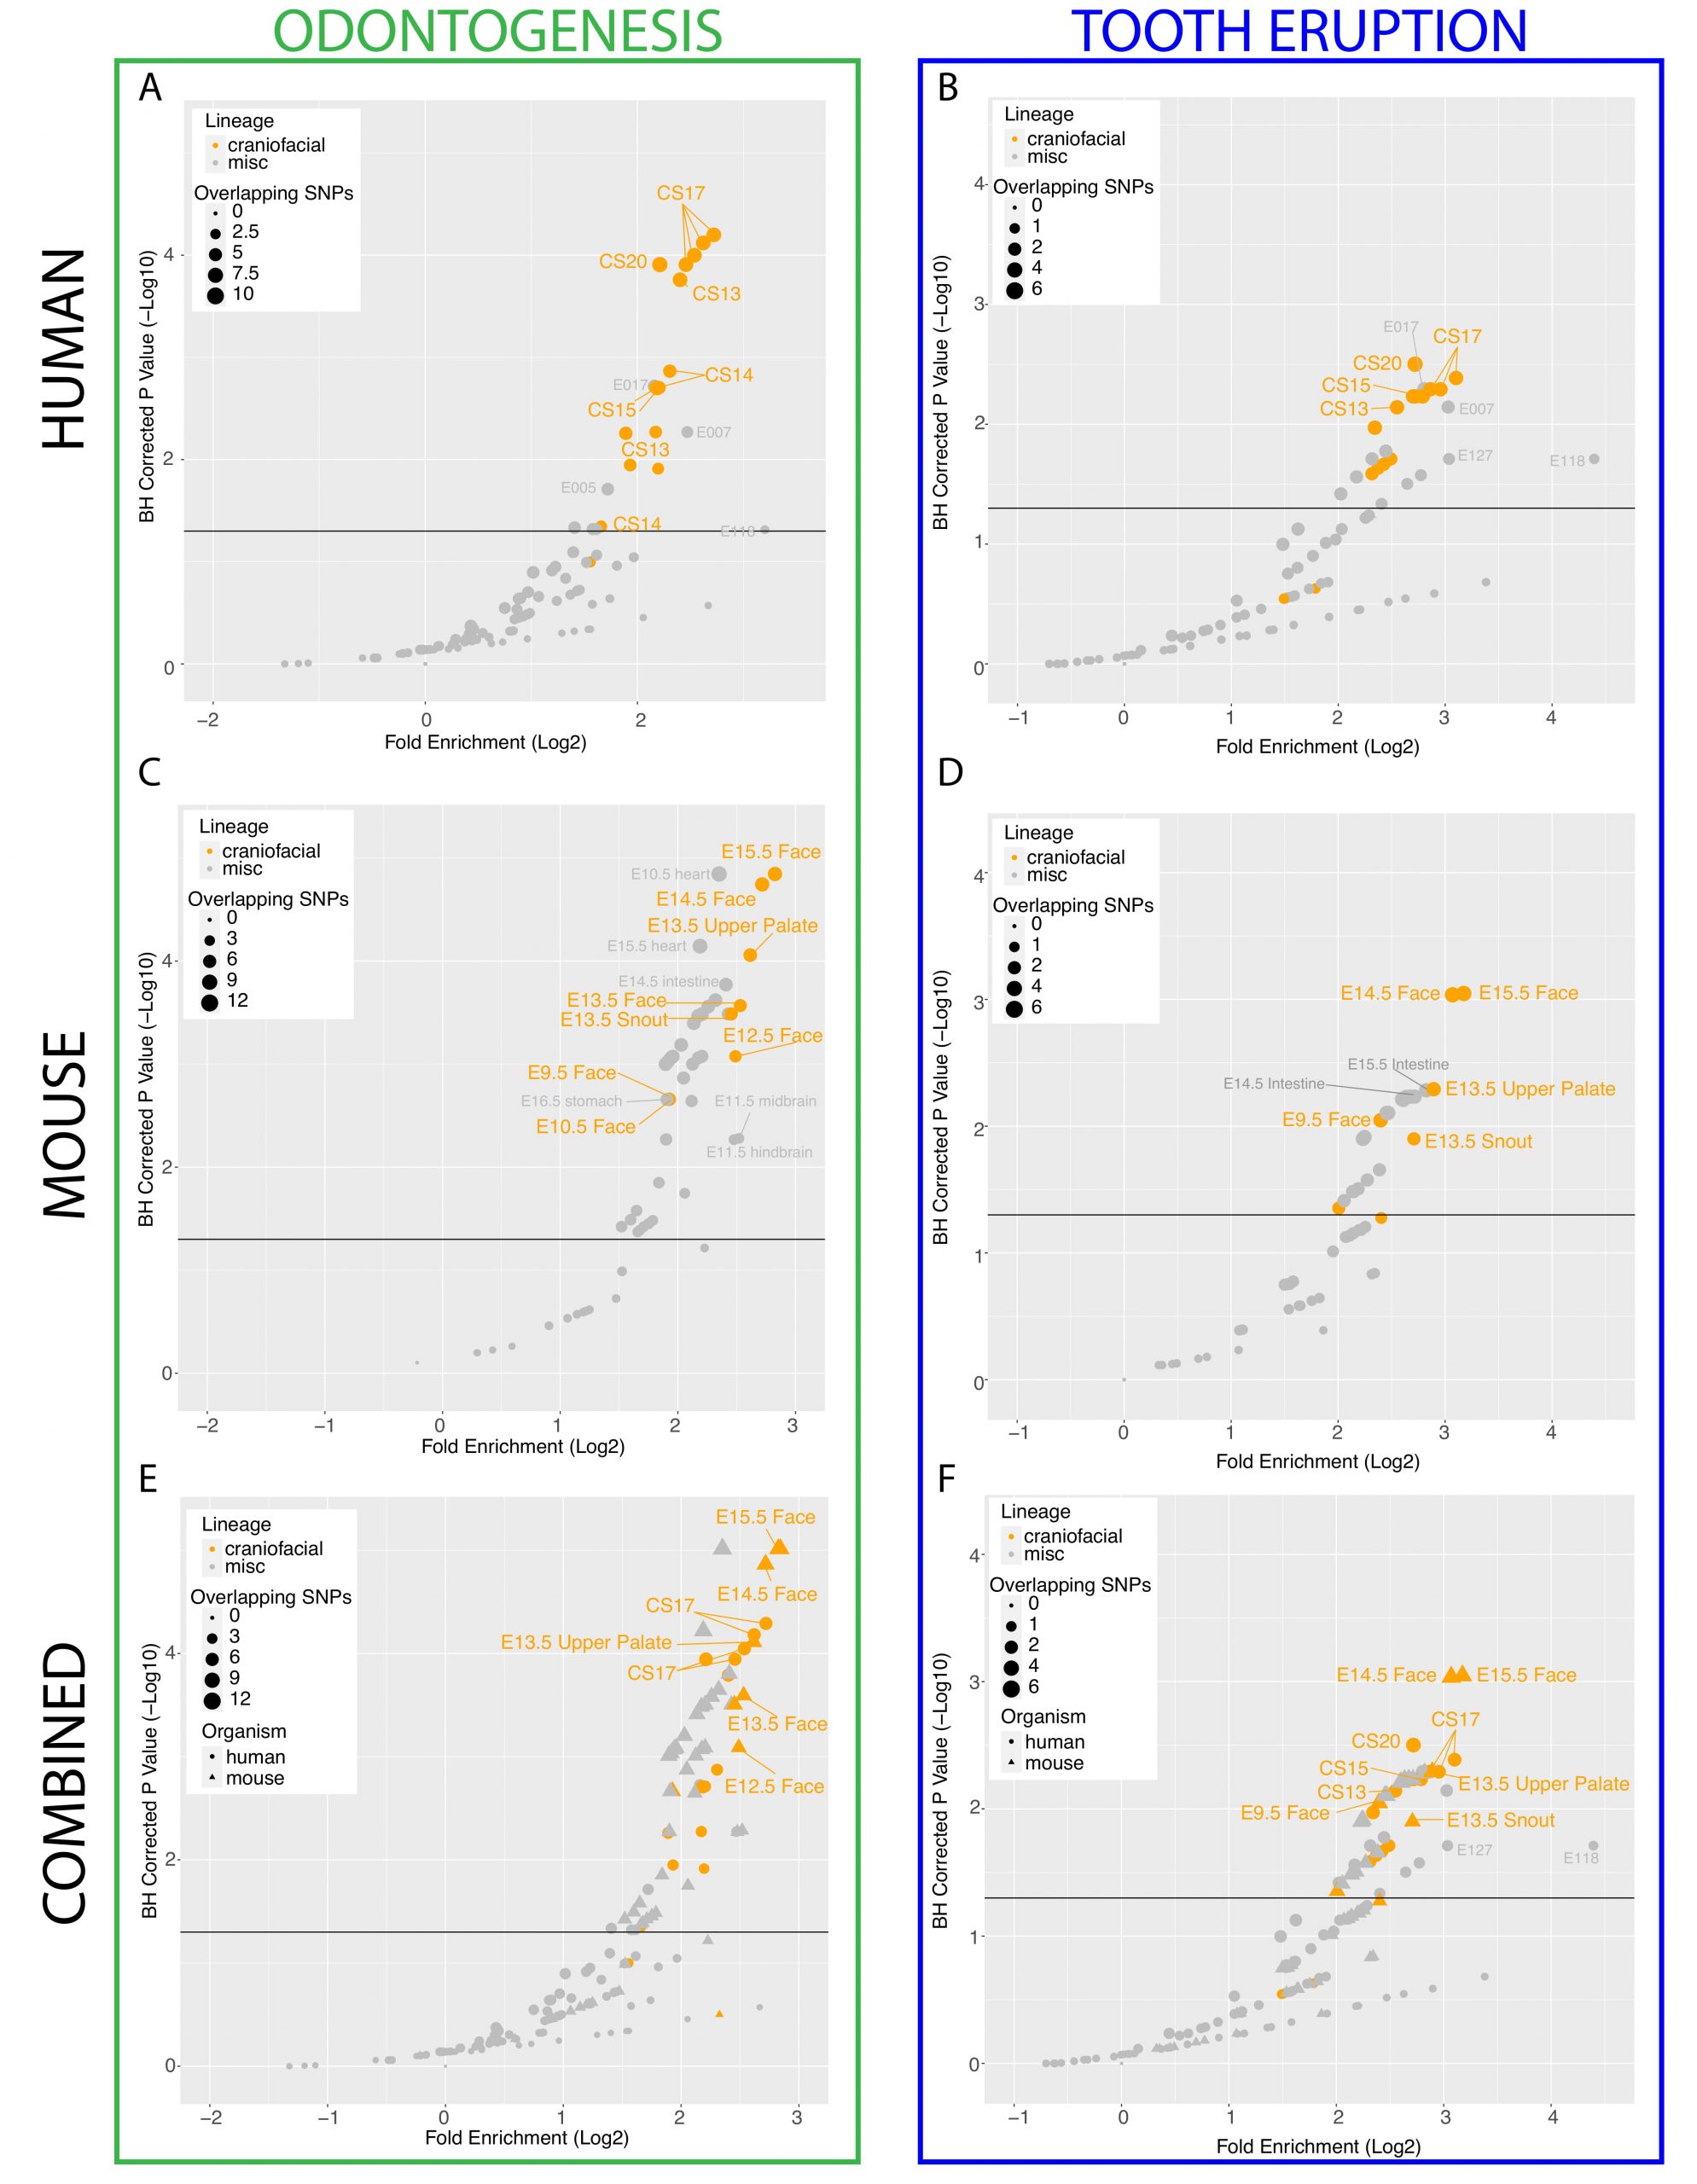
A. Scatterplot of GREGOR (genomic regulatory elements and GWAS overlap algoRithm) analysis of enrichment of “Odontogenesis” (GO_0042476)-associated variants from GWAS Catalog in active enhancers annotated by 18 state chromatin segmentations genome-wide for samples from [40](orange circles) and Roadmap Epigenome (grey circles). B. Scatterplot of GREGOR (genomic regulatory elements and GWAS overlap algoRithm) analysis of enrichment of “Tooth Eruption” (GO_0044691)-associated variants from GWAS Catalog in active enhancers annotated by 18 state chromatin segmentations genome-wide for samples from [40](orange circles) and Roadmap Epigenome (grey circles). C. Analysis as in A, with 18-state segmentations from Mouse ENCODE craniofacial (orange circles) and other mouse tissue samples (grey circles) [40,51,56]. D. Analysis as in B, with 18-state segmentations from Mouse ENCODE craniofacial (orange circles) and other mouse tissue samples (grey circles) [40,51,56]. E. Co-projected plots of A (circles) and C (triangles), F. Co-projected plots of B (circes), and D (triangles).
Hg19 Conserved Tooth Enhancer Explorer
Please find here an interactive UCSC genome browser session (hg19) of our human craniofacial 18 state chromatin segmentation tracks alongside our novel E13.5 mouse incisor enhancer calls.
Mm10 Conserved Tooth Enhancer Explorer
Please find here an interactive UCSC genome browser session (mm10) of our 18 state chromatin segmentation tracks of all mouse ENCODE alongside our novel E13.5 mouse incisor enhancer calls.
Exploration of VISTA-Validated Tooth Specific Enhancers
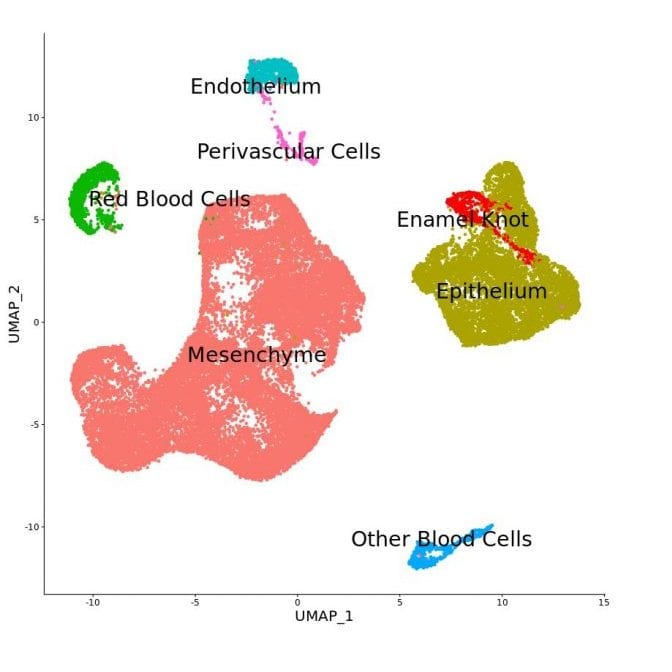
Single Cell Transcriptomics Identifies the Putative Enamel Knot
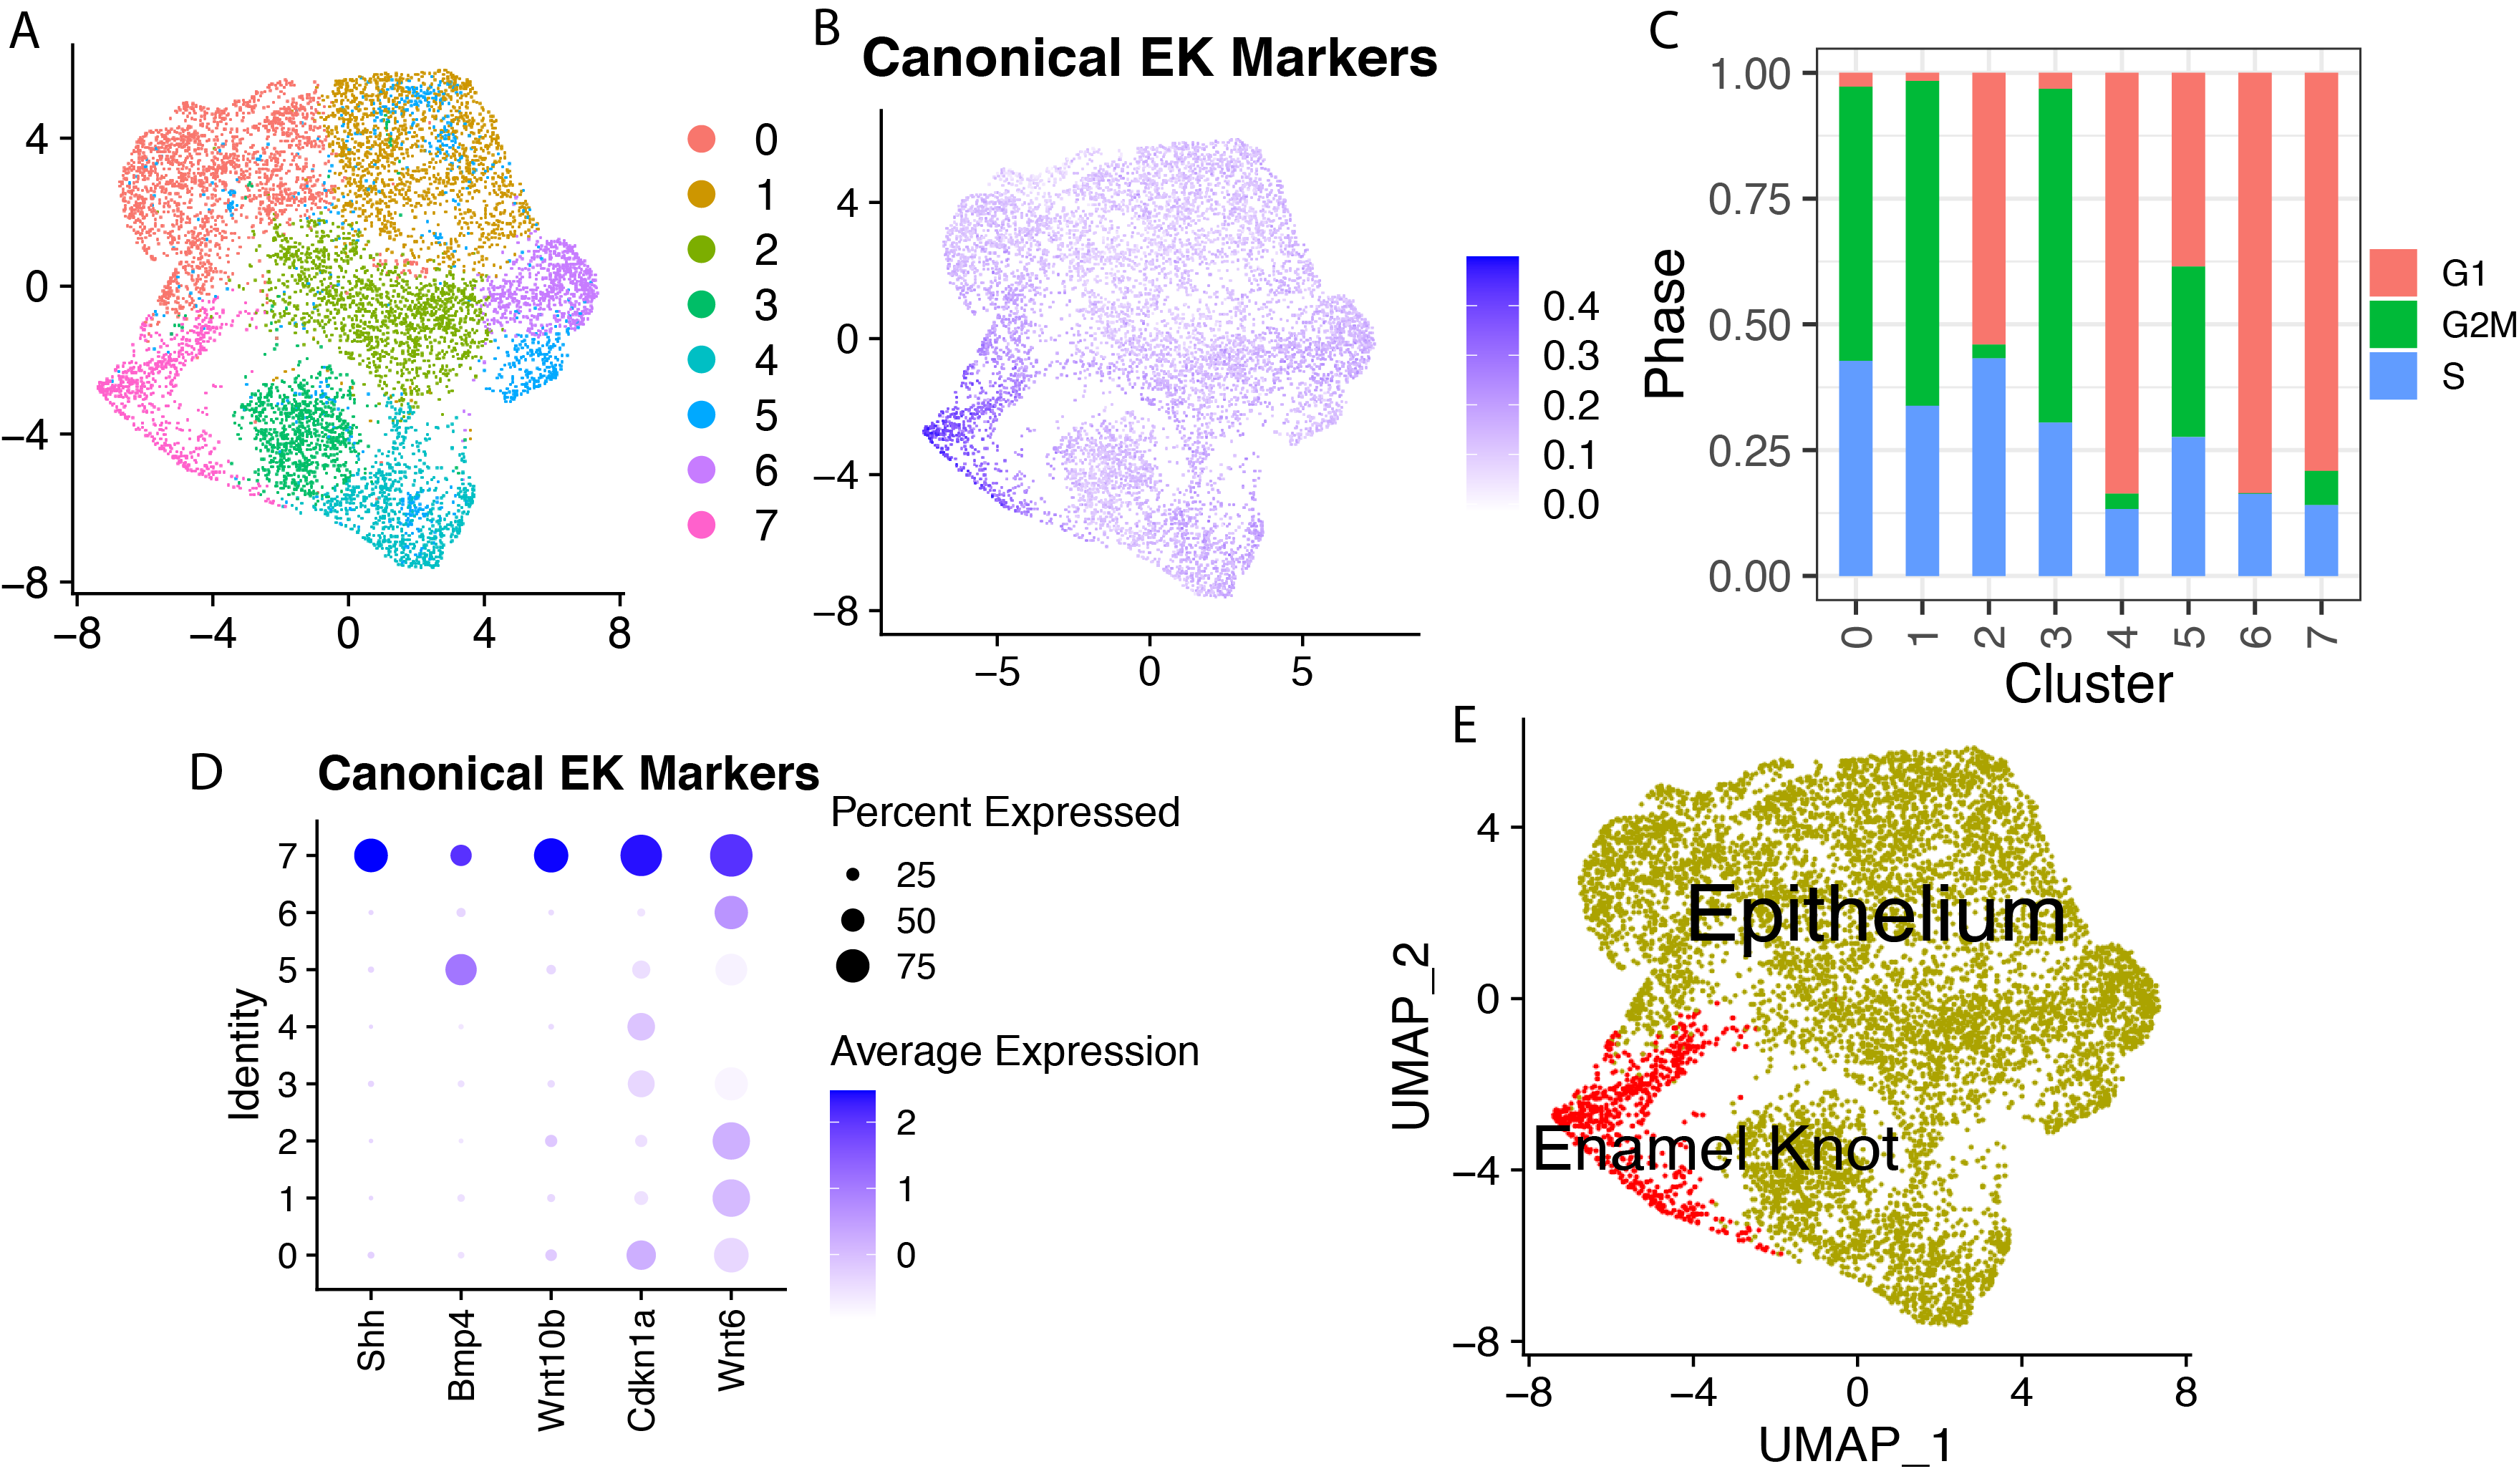
Single Cell Transcriptomics Identifies the Putative Enamel Knot
Exploration of the Putative Enamel Knot Transcriptomic Signature
WIF1 Locus is a Candidate for Human Odontogenic Phenotypes
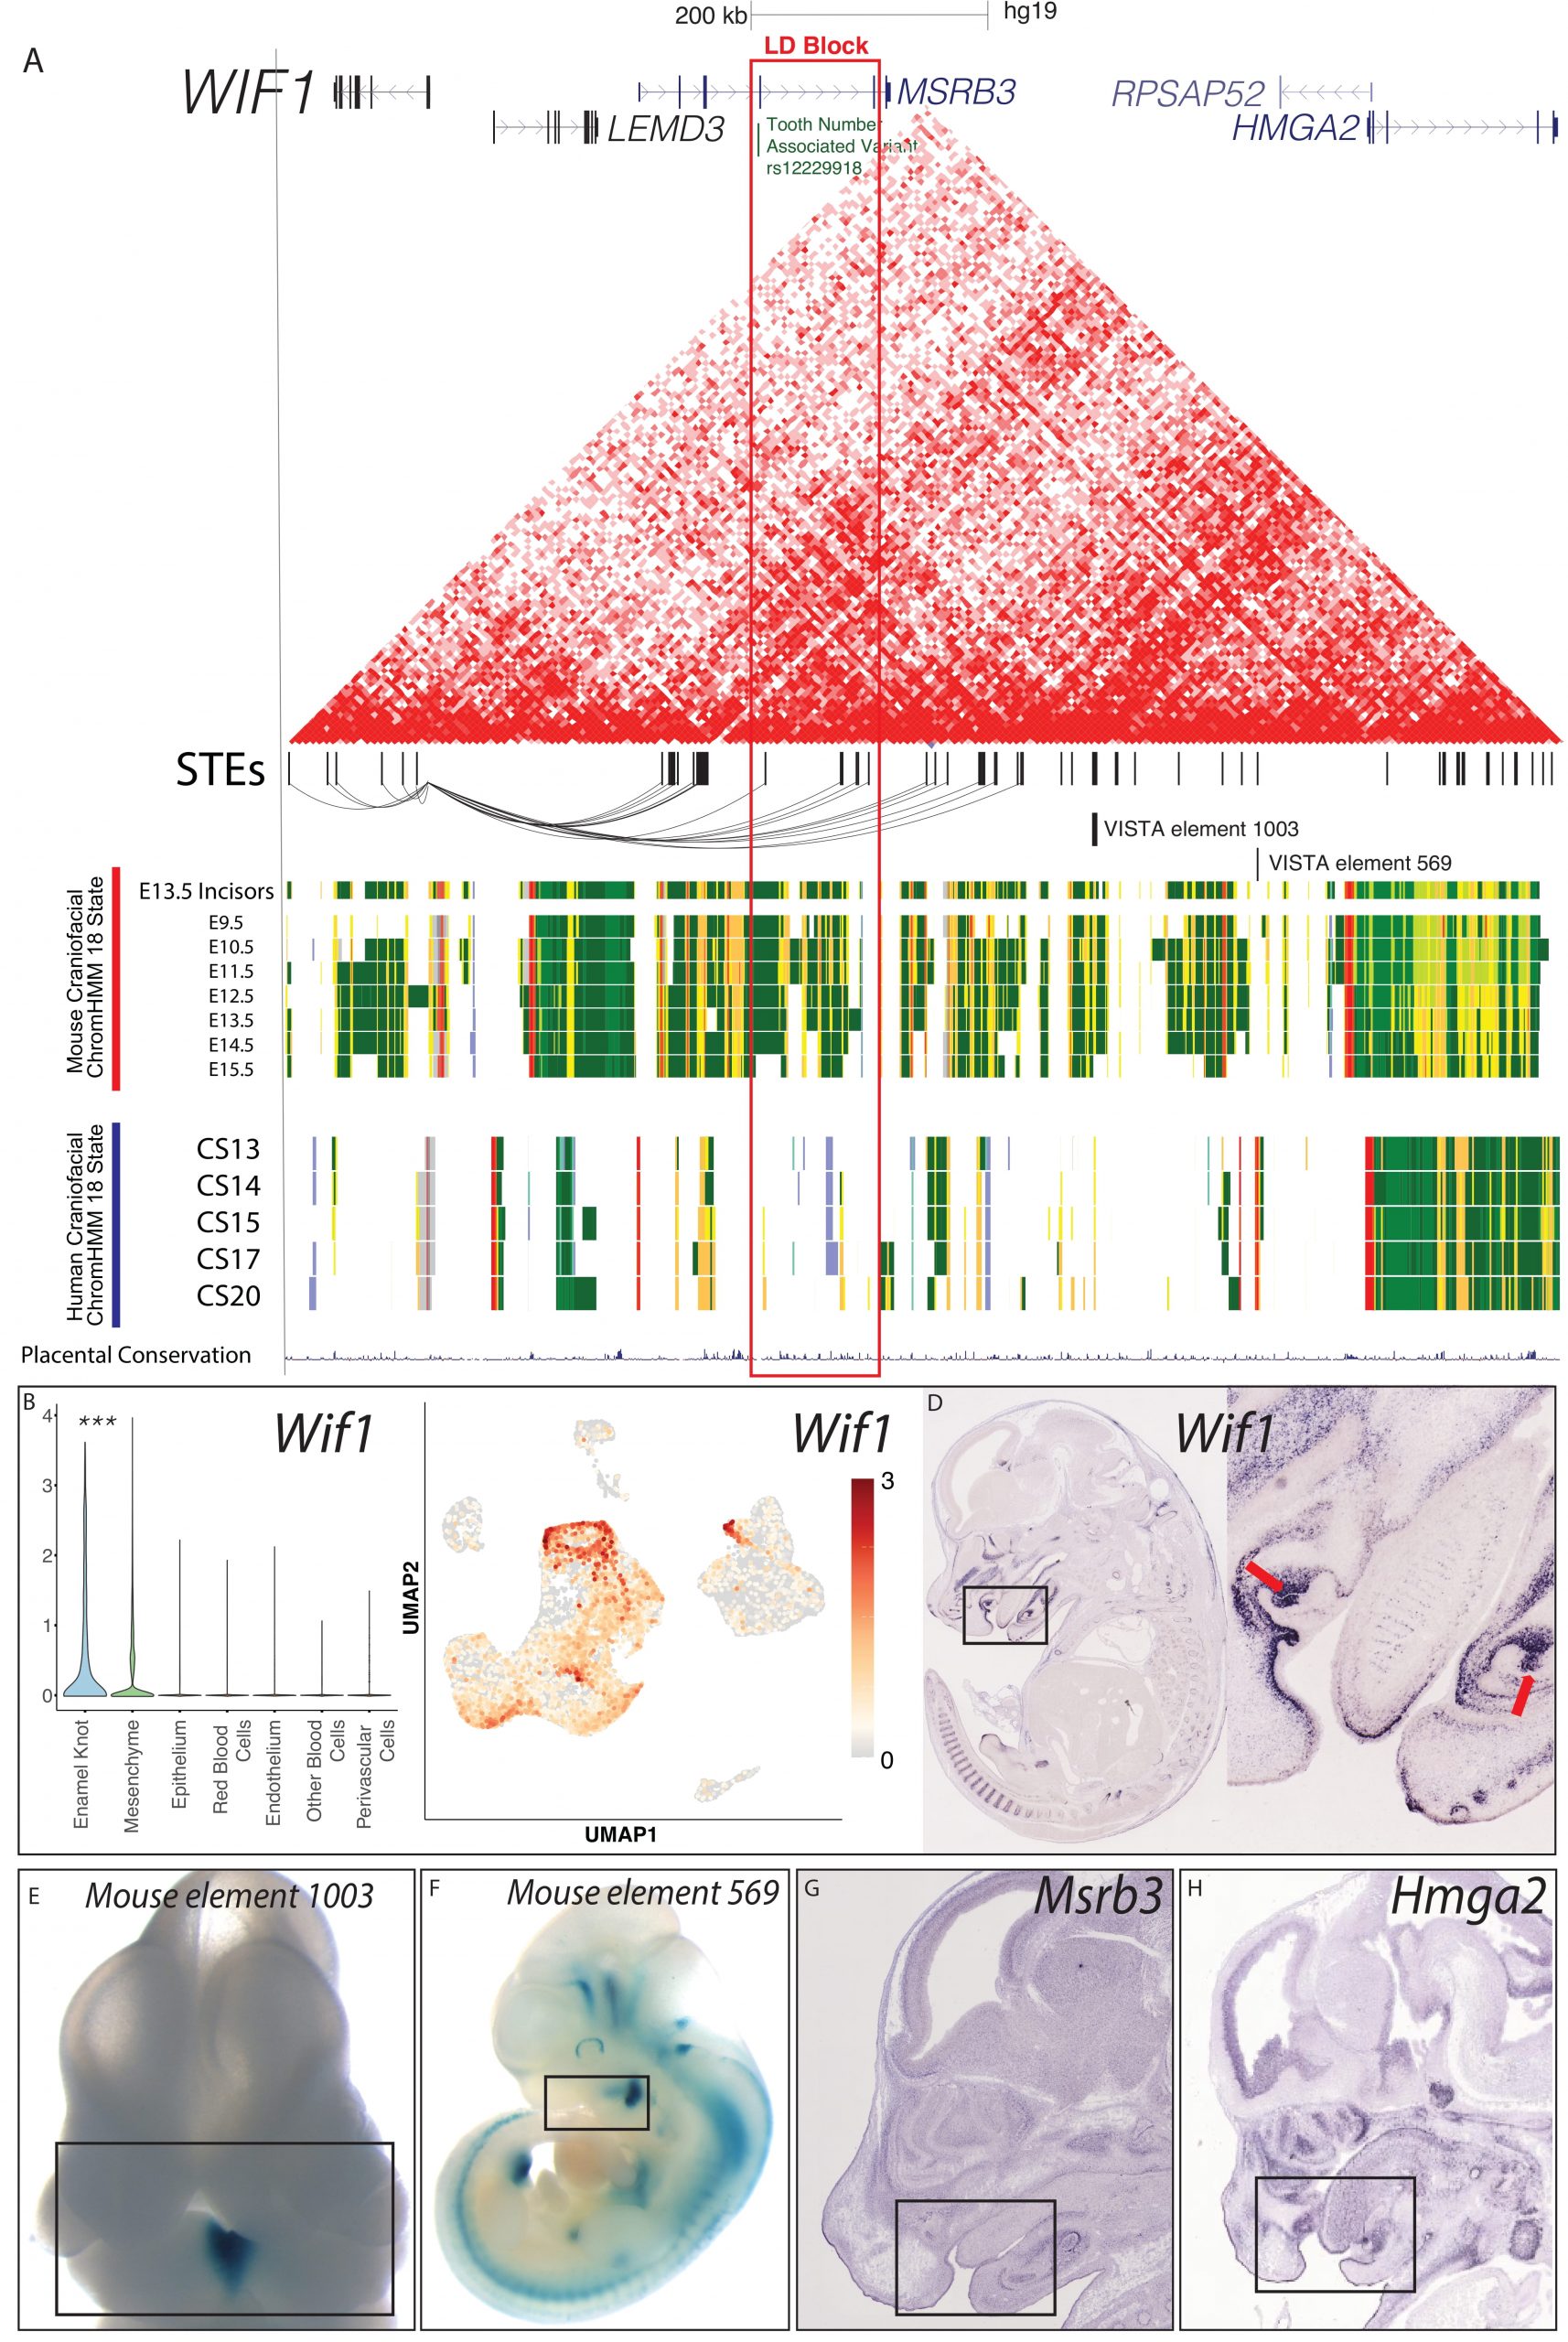
A. Visualization of the locus surrounding rs12229918 (chr5:134509987, hg19) and nearby fine-mapped variants associated with decreased tooth number and delayed tooth eruption by [83]. Chromatin conformation heatmap demonstrated from 1 replicate of human CS17 HiC from [130]. STEs are shown as hg19 coordinates. Mouse craniofacial 18 state segmentations were generated as described in Methods from data from ENCODE [56]; these rows are from mm10 coordinates of the orthologous locus containing the orthologous genes. Human craniofacial 18 state segmentations were obtained from [40]. B,C. Single cell transcriptomic analysis demonstrated the PEK-specific expression of Wif1 in the E14 mouse molar; p<0.05, Wilcoxon test. D-G. In situ hybridization images of Wif1 and Hmga2 were obtained from GenePaint [75]. Enhancer assay images were obtained from VISTA [94].